The dashboard that tells you what to do tomorrow morning.
Intelligence & Reporting is for owners, branch managers, and accountants who’ve been asking “where are we” at 9:40 pm and getting three different answers from three tools. This pillar replaces the monthly Excel review deck with a dashboard that’s current, consolidated, and one screen.
Six categories of dashboard and reporting that run day-to-day decisions.
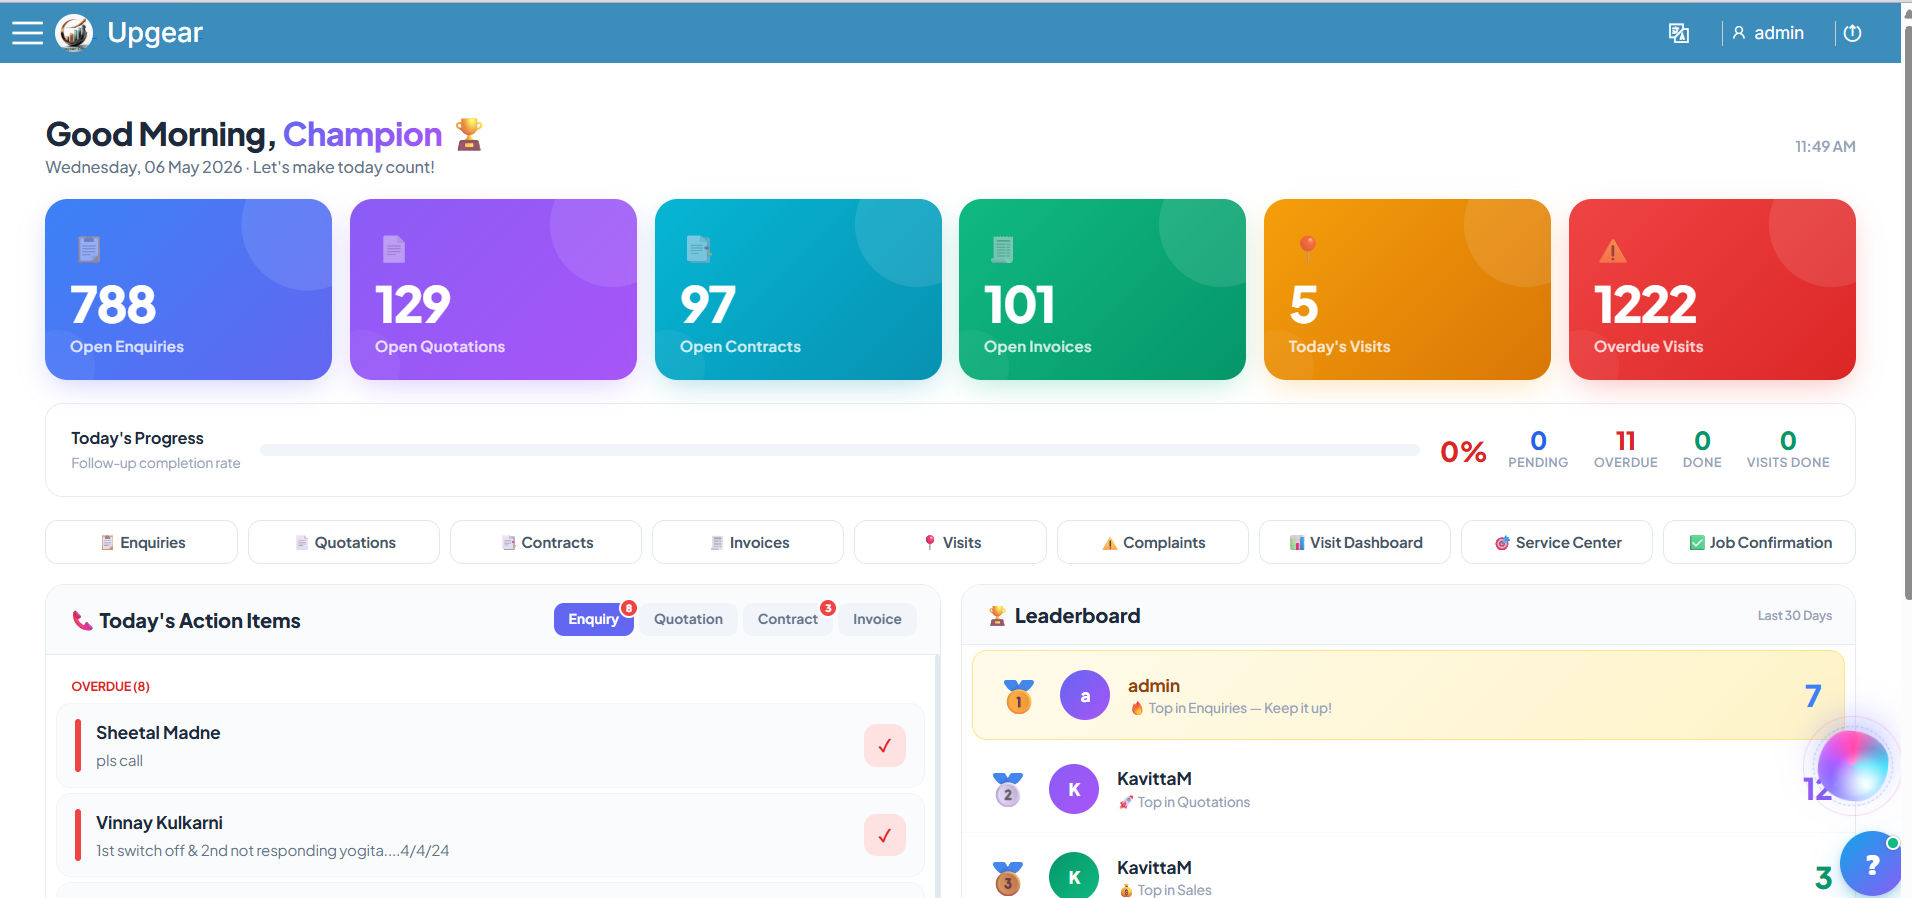
Top-line revenue, collections, outstanding, pipeline value, today’s visits, employee headcount, this-month invoices and payments — on one screen. All multi-company consolidated by default, filterable to a single entity. Built for the 9:40 pm “where are we” question, not for the Monday-morning meeting. Distinct from the operational dashboard which is more transactional.
Rolling KPI snapshot by rep, by branch, by company, by service category. When you need to see “what changed this quarter,” this is the screen. Representative Performance is one click deeper.
For any customer: every enquiry, quotation, contract, invoice, payment, visit, complaint, and conversation in one view. Your sales rep preparing for a renewal call, your ops lead preparing for a complaint meeting, your accountant chasing a payment — all working from the same page.
The Commission Dashboard ends the monthly rep argument. The Complaints Dashboard surfaces repeat-offender customers or sites. The Finance Dashboard tracks collection, outstanding, and aging. Consumption Insights rolls up chemical or consumable usage by month, by pest type, by branch.
Not a firehose of noise. Specific alert producers that fire on signal — a flagged attendance mismatch, an overdue followup, a contract about to lapse, a renewal reply that needs human attention. Alert producer coverage expands through 2026; today’s coverage is on the highest-leverage signals.
Every edit to a customer, contract, invoice, employee, or payroll record is captured — who, when, what changed. Your accountant’s “who changed this invoice date” question becomes one click, not a WhatsApp investigation. Audit-ready for ISO, HACCP, food-plant vendor reviews, and commercial InfoSec checklists.
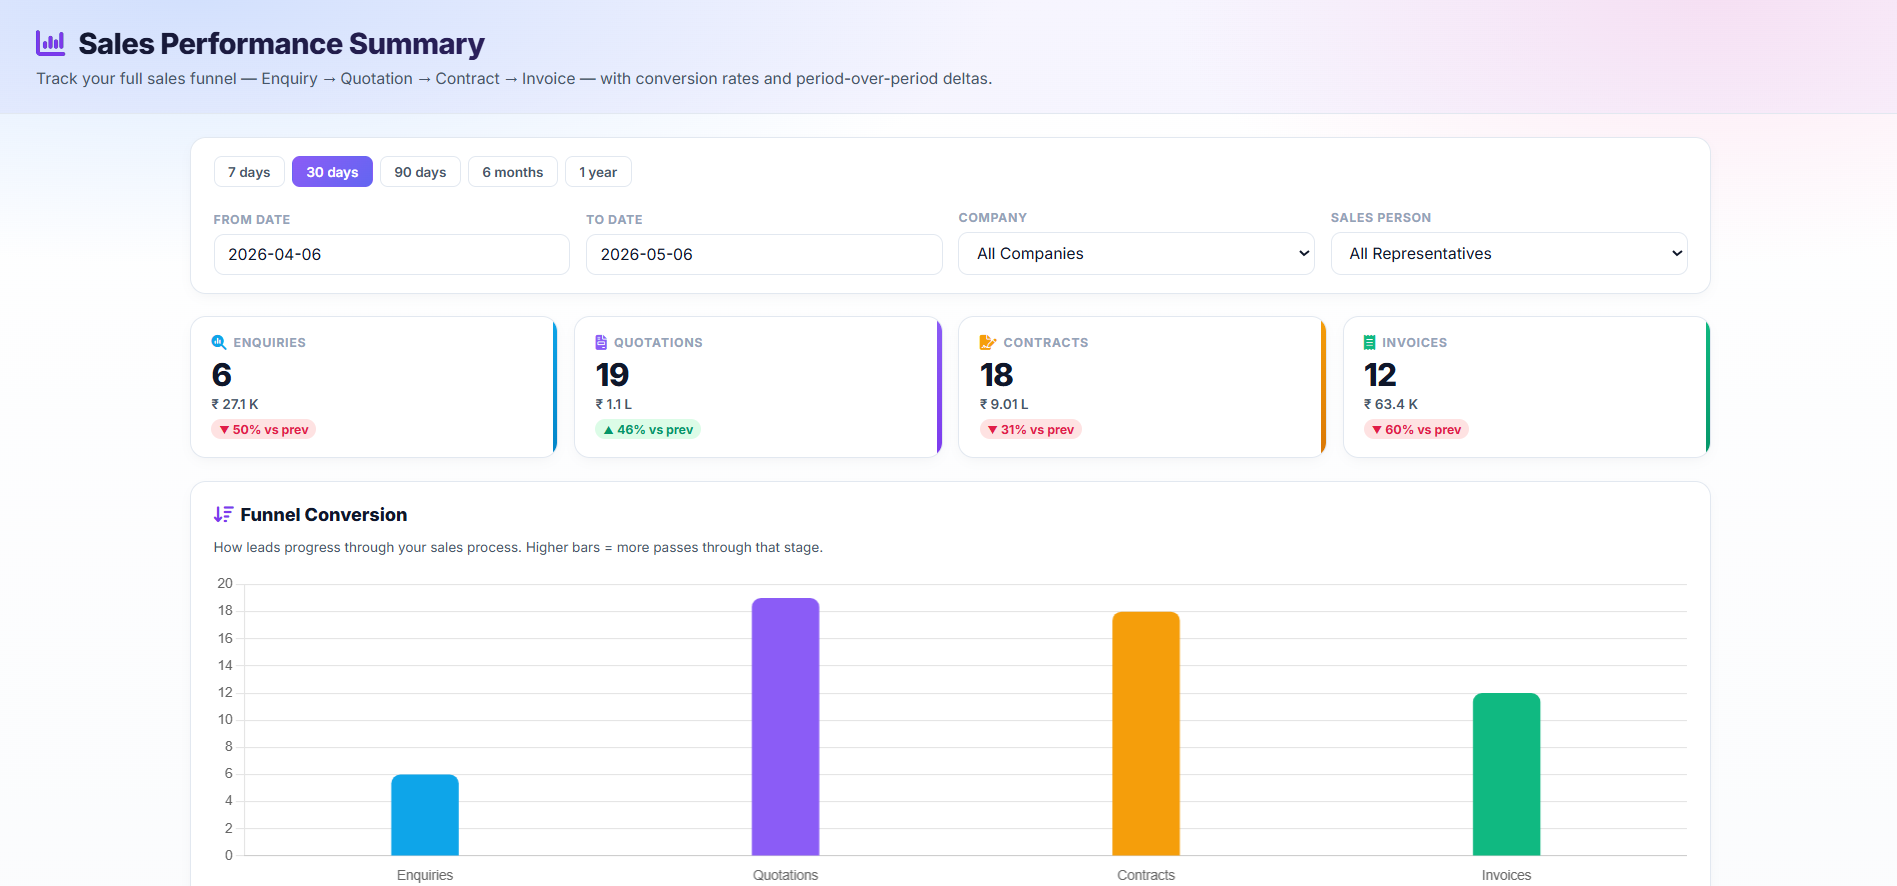
Outstanding (Sales − Collections), Collection Rate, average invoice value, active customers. Top Performers spotlight (Top Rep / Top Company / Top Branch with share-of-total). Daily Sales Trend, Sales vs Collections by Company. Print-friendly. Answers “where should I focus this month?”, not just “what did we do?”.
ABC Analysis (80/20 of revenue contribution by SKU), Batch Expiry, Inventory 360, Low Stock, Stock Movement, Stock Valuation, Tech Hand Stock, Vendor Performance, Wastage Analysis — each with KPI cards and drill-down tables, mobile-responsive, print-friendly.
Three views of the operation, on one screen each.
The Owner Dashboard is the executive view — top-line revenue, collections, outstanding, pipeline value, today’s visits, employee headcount, this-month invoices and payments — all on one screen. The screenshot below is the full-resolution version; click to expand.
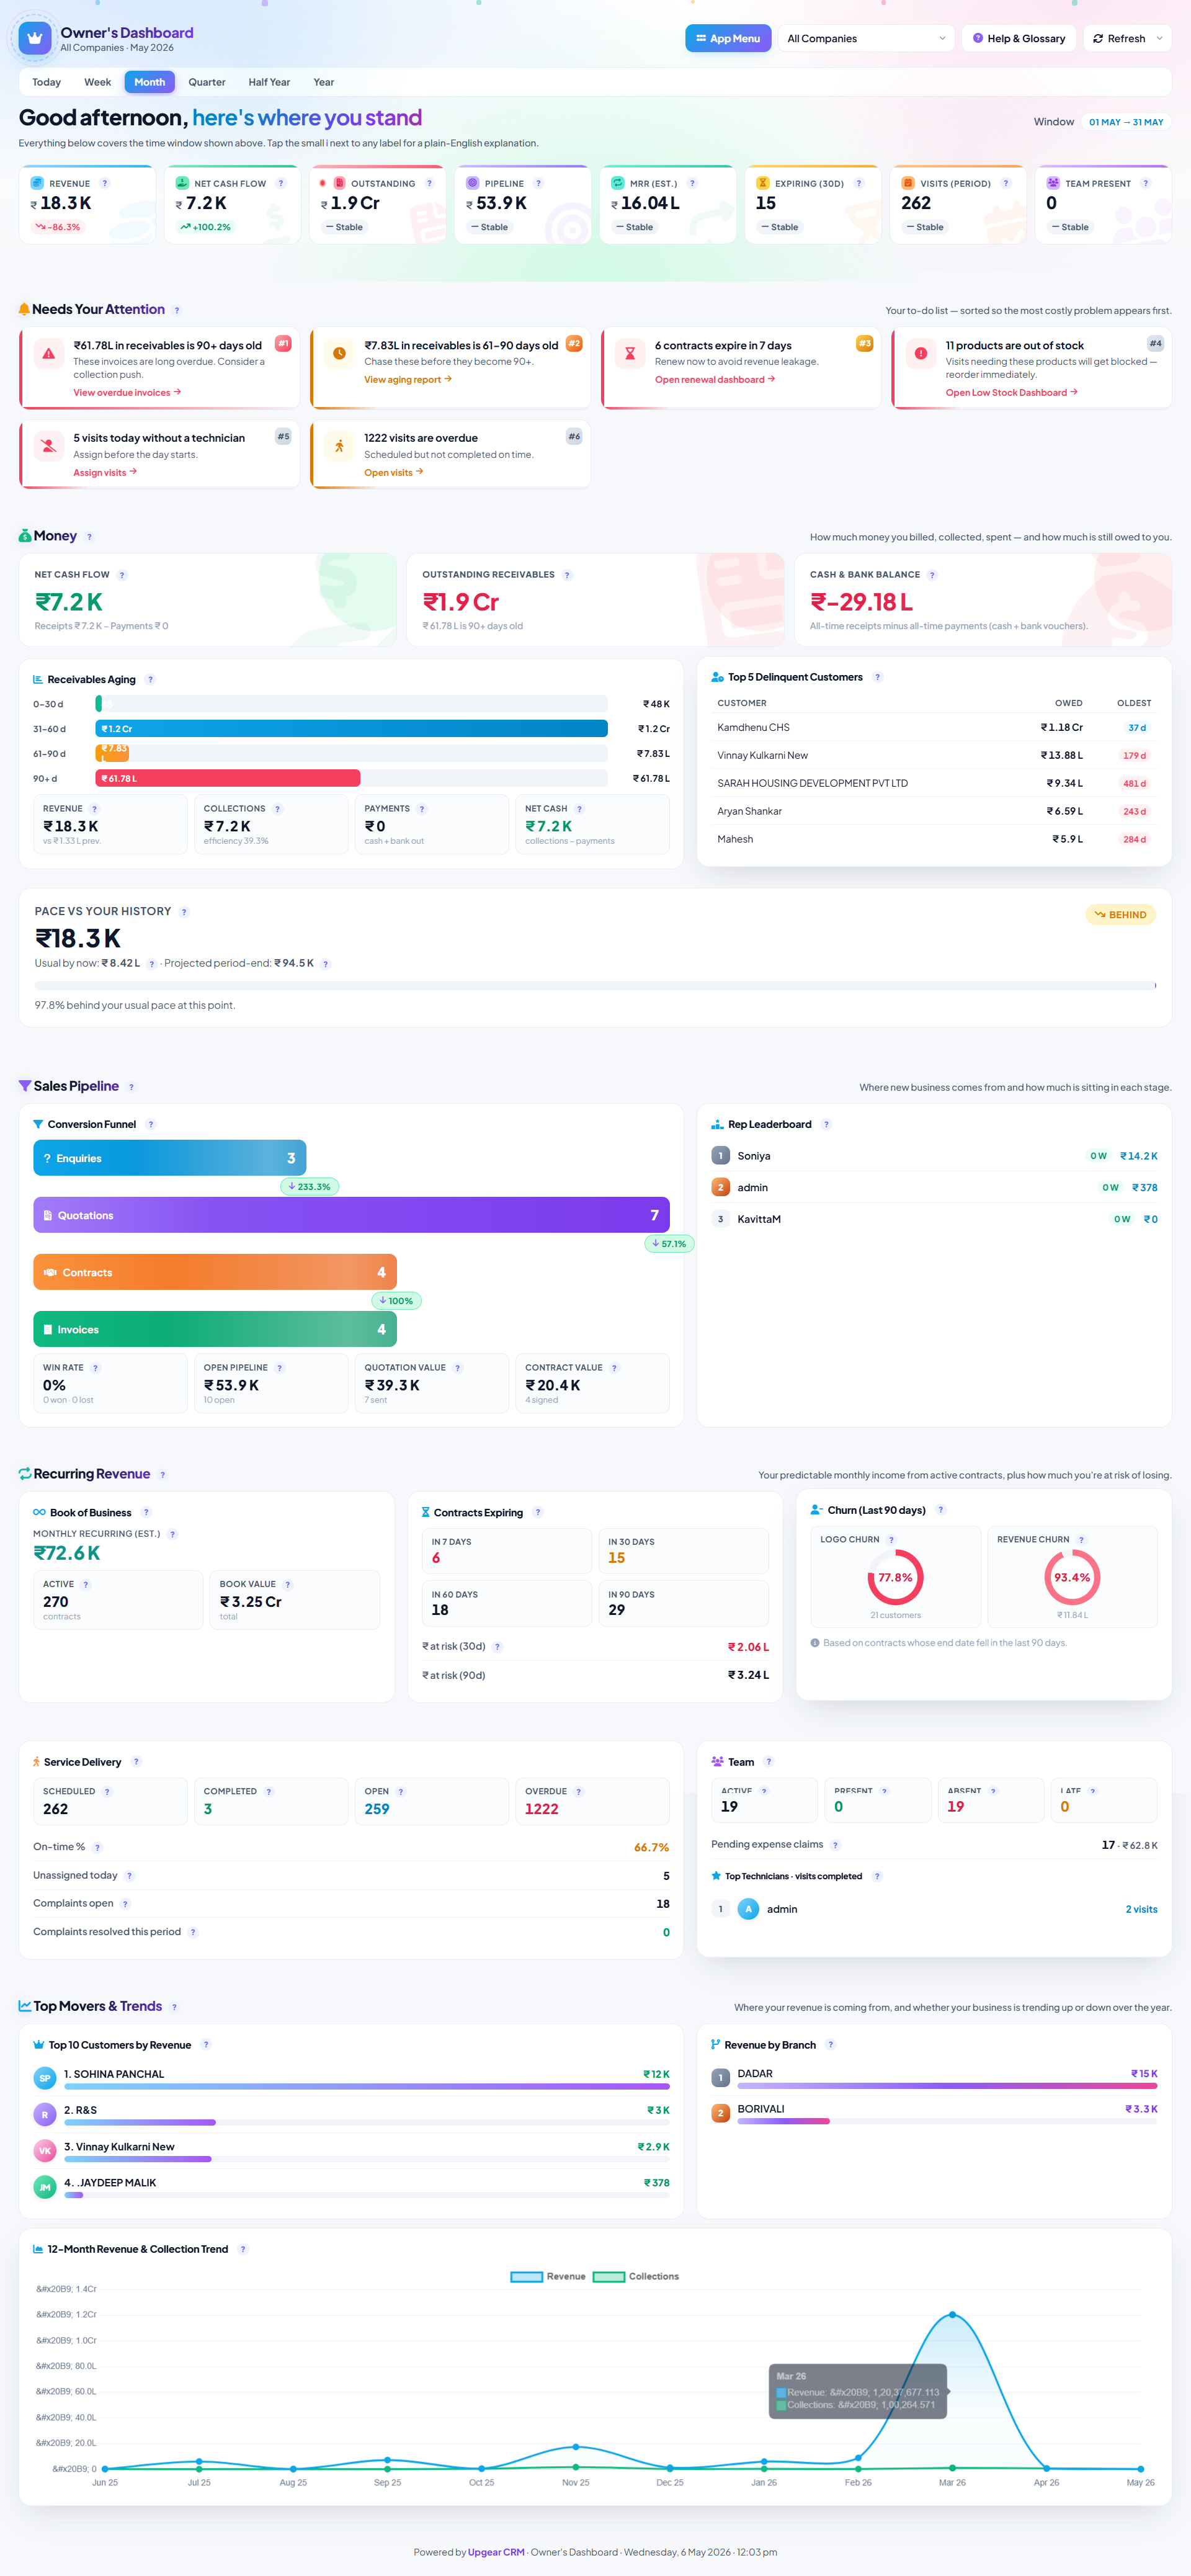
9:40 pm, knowing where the business is.
It’s 9:40 pm on the 14th. You’ve been in a customer meeting since 3. You open Upgear on your phone while your tea cools down. The Owner’s Dashboard loads: revenue MTD vs. same-time-last-month, cash-in for the week, outstanding total, renewals pending in the next 30 days, enquiries generated today.
Two numbers catch your eye. Outstanding is up ₹1.8 lakh from last week; one customer account shows the whole increase. A renewal from a large corporate client is three days overdue for a reminder — the send is queued, but the customer hasn’t replied yet. You WhatsApp your ops lead: “call corporate client X in the morning, see if they want to extend.” You close the phone by 9:48.
The next morning the ops lead handles it before 10 am. The renewal signs by noon. Without the dashboard, you’d have found out about it on the 20th when the old contract lapsed and the customer stopped receiving visits. That single renewal — ₹2.4 lakh/year — pays for Upgear Core for 22 years. Pick any month; find the same story.
Eight dashboards you’ll open daily or weekly.
These are the highest-leverage dashboards across the 49 built-ins. Different roles use different ones; most operators settle into 3–5 as their daily-open set.
Three reporting workarounds, one pillar.
Owners live in this pillar. Ops and accounting open specific dashboards daily.
Every service operator beyond the first branch needs this.
Intelligence & Reporting matters from the moment you have more than one branch or more than a handful of employees — which is every operator we serve. The specific dashboards that matter vary by sector; the underlying pillar doesn’t.
What operators ask about dashboards.
See your own dashboards in Upgear in 30 minutes.
Founder-led demo. Bring the question you most want answered about your business — revenue drift, commission fairness, renewal pipeline, chemical consumption, complaints — and we'll show you which dashboard answers it, on your own-looking data.